The goal of this workshop is to not only present the theory and properties of MTAG, but also demonstrate the ease of its application.
Specifically,
- Software built to work from the command line: no programming required
- However, can easily be integrated into Python pipeline (not covered here)
- Organized like the LD Score Regression (
ldsc) tool
- Tutorials and manuals provided on the Github repository
0. Setup
(has already been done for you ..)
Install Python
- To begin, you need a distribution of Python 2.7 (such as from Anaconda) with the following packages:
numpy,scipy,pandas,argparse,bitarray,joblib.- will also work with Python 3 soon
- You should be able to call Python by typing in
python(or a similar command) in the command line. - Explained in the
READMEfound in the Github repository.
Cloning MTAG from Github
- navigate to your folder of choice (
IGSS_2017_mtag_workshopin this demonstration) - use
git clone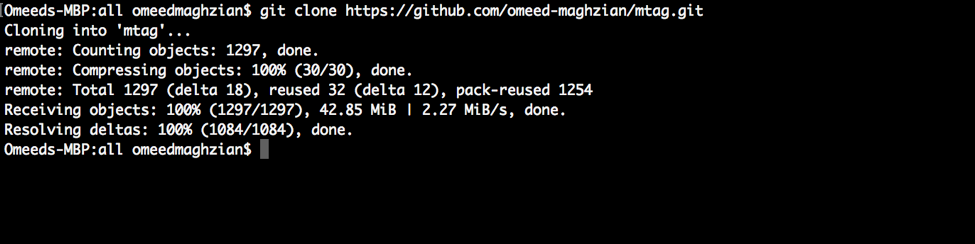
- You should now see a folder named
mtagthere
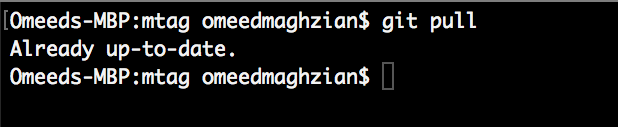
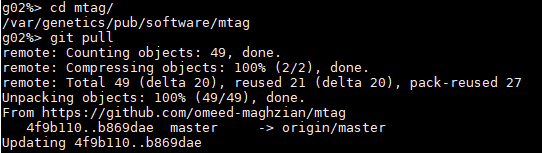
Updating MTAG
- navigate into the
mtagfolder - type
git pull
- Up-to-date:
- Otherwise, will update:
1. Basics
Summary statistics for this section:
| Trait number | Trait | Filename |
|---|---|---|
| 1 | Subjective well-being (SWB) | 1_OA2016_hm3samp_SWB.txt |
| 2 | Neuroticism (NEUR) | 1_OA2016_hm3samp_NEUR.txt |
- Publicly-available sumstats from:
Okbay et al. "Genetic variants associated with subjective well-being, depressive symptoms, and neuroticism identified through genome-wide analyses." Nature Genetics 48, 624–633 (2016).
- Sample (~10%) of Hapmap 3 SNPs
- Found in the
datafolder
A quick primer on Linux
We will only go over the minimum detail needed to follow along in the workshop. There are many good resources for working with Unix available online.
Simple commands
cd [path]: change directory to[path](can be relative or absolute)ls [path]: list the files and folder in[path]head -n [N] [file]: view the first[N]lines of[file].taillets you view the last[N]lines.python [path] [-options]: run[path]as a Python script with some options specified. This is how we run MTAG.
Running Bash/Shell scripts
- You can write a sequence of commands (and comments) in a
.bashor.shscript bash [file.bash]executes these commands
- This is the easiest way to run the MTAG commands in this tutorial
Listing options (-h)
- General format:
python [PATH_OF_MTAG_CODE] -h - For, example in the
mtagfolder:
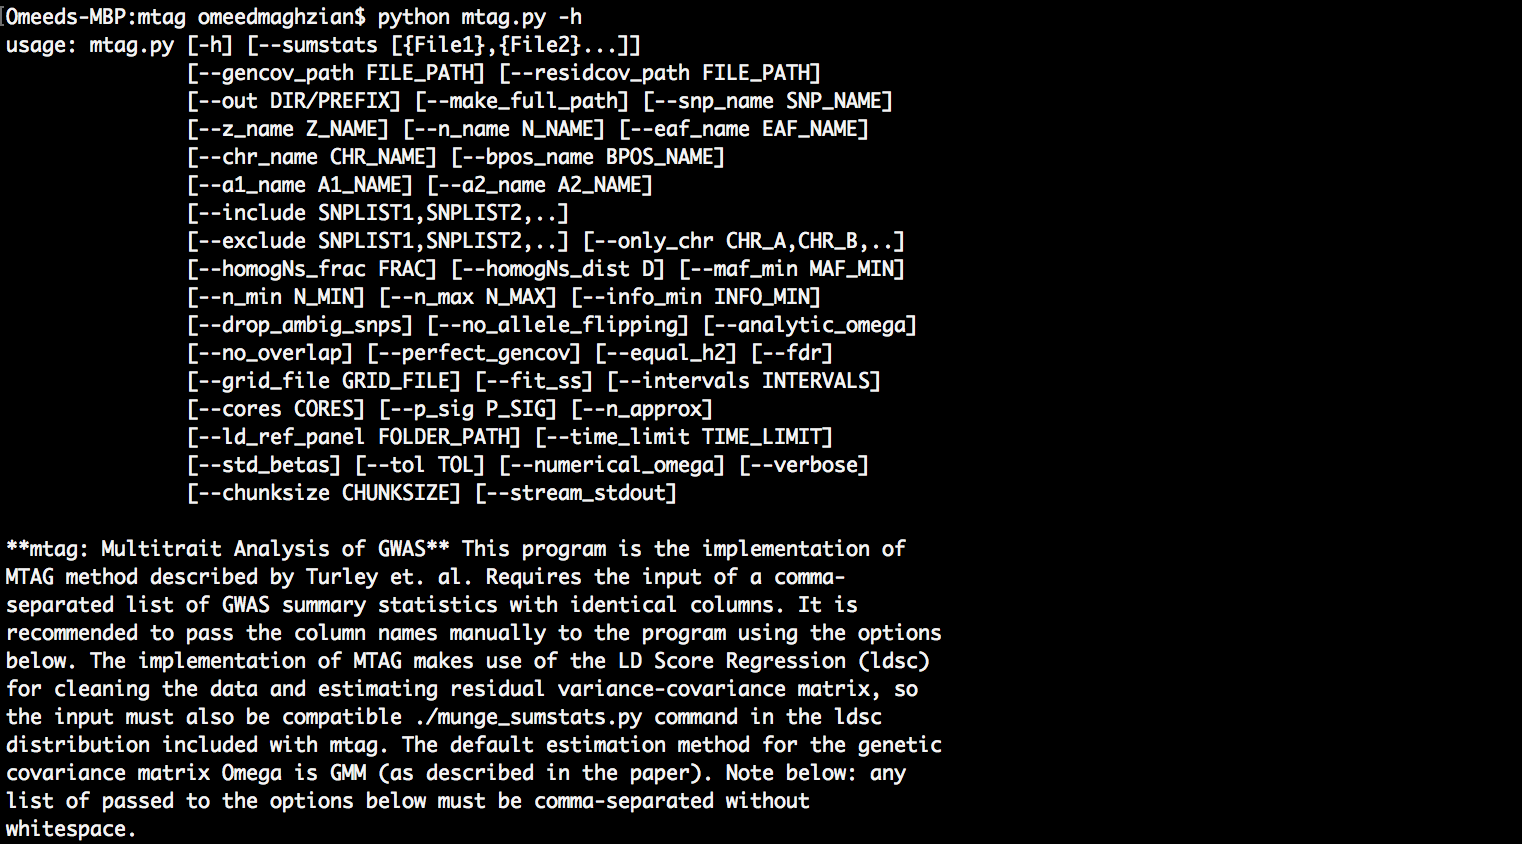
# 1.1_access_help.bash
!python ../mtag/mtag.py -h
A. The two options that must always be specified
--sumstats [File1],[File2],..- Comma-separated list of summary statistics files to apply MTAG. Currently, files must be whitespace-delimited and must either have the default column names or column names that are provided through options (see below).
- Should also make sure that files can be read by
ldsc(included in themtagfolder)
--out [output_folder][prefix]- The path provided consists of a folder
[output_folder](e.g.,../output/or./) - The
[prefix](e.g.,igss_mtag_tutorial_) is prepended to the files produced by MTAG
- The path provided consists of a folder
B. Sumstats file formatting
- The column names must be consistent across all sumstats files.
- At present
mtagdoes not "guess" the column names (will hopefully do that soon). - Column order does not matter.
- All files must be whitespace (tab) delimited
- At present
The workshop files provided contain the "default" column names for MTAG
bash 1.2_view_sumstats.bash
# 1.2 view sample sumstats files (for format)
!head ../data/1_OA2016_hm3samp_NEUR.txt # 1.2
All of the columns shown above are necessary for MTAG to run
!tail -5 ../data/1_OA2016_hm3samp_NEUR.txt
!sed -n '103995,104000p' ../data/1_OA2016_hm3samp_NEUR.txt
Running MTAG with the defaults
Using mtag with the default options implements the following steps:
- Read in each summary statistics file in the list and "munges" (filters/clean) them, in particular MTAG:
- Only keeps SNPs with Minor Allele Frequency (MAF) $ \geq 0.01$
- Only keeps SNPs with sample size $N \geq \frac{2}{3} F^{-1}_N(90)$ (greater than two-thirds of the 90th percentile)
- Merge the filtered GWAS summary statistics results together, taking the intersection of available SNPs (accounting for lists of SNPs to
includeand/orexclude). - Estimate the residual covariance matrix, $\Sigma_{LD}$, using the intercept of LD Score regression (
ldsc, longest step). - Estimate the genetic covariance matrix, $\Omega$.
- Calculate MTAG-adjusted statistics and output results.
Running MTAG with the defaults
Call the mtag.py script via python
Note: we use the --stream_stdout so that messages from MTAG are printed to the console in addition to the log file.
bash 1.3_mtag_default.bash
# 1.3_mtag_default.bash
!python ../mtag/mtag.py  \
        --sumstats ../data/1_OA2016_hm3samp_NEUR.txt,../data/1_OA2016_hm3samp_SWB.txt \
        --out ../output/1_basics/1.3_mtag_default_NS \
        --stream_stdout
Interpreting Output
Reading the log file: masthead
<><><<>><><><><><><><><><><><><><><><><><><><><><><><><><><><><><><><><><><>
<>
<> MTAG: Multitrait Analysis of GWAS
<> Version: 1.0.1
<> (C) 2017 Omeed Maghzian, Raymond Walters, and Patrick Turley
<> Harvard University Department of Economics / Broad Institute of MIT and Harvard
<> GNU General Public License v3
<><><<>><><><><><><><><><><><><><><><><><><><><><><><><><><><><><><><><><><>
<> Note:  It is recommended to run your own QC on the input before using this program.
<> Software-related correspondence: maghzian@nber.org
<> All other correspondence: paturley@broadinstitute.org<><><<>><><><><><><><><><><><><><><><><><><><><><><><><><><><><><><><><><><>


Calling ./mtag.py \
--stream-stdout  \
--sumstats ../data/1_OA2016_hm3samp_NEUR.txt,../data/1_OA2016_hm3samp_SWB.txt \
--out ../output/part_2/igss_mtag_default_NS

Beginning MTAG analysis...
Reading the log file: munging
<><><<>><><><><><><><><><><><><><><><><><><><><><><><><><><><><><><><><><><>
Munging Trait 1  <><><<>><><><><><><><><><><><><><><><><><><><><><><><><><><
<><><<>><><><><><><><><><><><><><><><><><><><><><><><><><><><><><><><><><><>
Interpreting column names as follows:
snpid:    Variant ID (e.g., rs number)
n:    Sample size
a1:    Allele 1, interpreted as ref allele for signed sumstat.
pval:    p-Value
a2:    Allele 2, interpreted as non-ref allele for signed sumstat.
freq:    Allele frequency
z:    Directional summary statistic as specified by --signed-sumstats.
...
...
...
Reading the log file: estimation
...
... Merge of GWAS summary statistics complete. Number of SNPs:     20321
Using 20321 SNPs to estimate Omega (0 SNPs excluded due to strand ambiguity)
Estimating sigma..
Checking for positive definiteness ..
Sigma hat:
[[ 1.043 -0.129]
 [-0.129  0.966]]
Beginning estimation of Omega ...
Using GMM estimator of Omega ..
Checking for positive definiteness ..
Completed estimation of Omega ...
Beginning MTAG calculations...
 ... Completed MTAG calculations.
Writing Phenotype 1 to file ...
Writing Phenotype 2 to file ...
...
Reading the Log File (Summary Output)
Summary of MTAG results:
------------------------
  Trait                 N (max)  N (mean)  # SNPs used  GWAS mean chi^2  MTAG mean chi^2  GWAS equiv. (max) N
1  ...hm3samp_NEUR.txt  111111   111111    20321        1.407            1.488            133309
2  ..._hm3samp_SWB.txt  111111   111111    20321        1.269            1.408            168490

Estimated Omega:
[[  3.817e-06  -2.199e-06]
 [ -2.199e-06   2.336e-06]]

Estimated Sigma:
[[ 1.043 -0.129]
 [-0.129  0.966]]
(genetic correlation estimated by MTAG)
[[ 1.       , -0.7363645],
 [-0.7363645,  1.       ]]
Results files
bash 1.3b_list_files.bash
# 1.3b_list_files.bash
!ls ../output/1_basics/1.3*
Results files
T + 3 files (T number of input sumstats), all whitespace-delimited
*.log: Log file (shown above)*_omega_hat.txt: Estimated genetic covariance matrix*_sigma_hat.txt: Estimated residual covariance matrix
*_trait_[t].txt: MTAG results for trait $t=1,\ldots, T$- Let's look at these files a bit more ...
bash 1.3c_view_mtag_output.bash
!head "../output/1_basics/1.3_mtag_default_NS_trait_1.txt"
| snpid | a1 | a2 | z | mtag_beta | mtag_se | mtag_z | mtag_pval |
|---|---|---|---|---|---|---|---|
| rs2736372 | T | C | -7.71614161262 | -0.0312843727759 | 0.00401008053375 | -7.80143254297 | 6.12083232605e-15 |
| rs10096421 | T | G | -7.561098219 | -0.0292358562051 | 0.0039656035404 | -7.37235982046 | 1.67633824925e-13 |
| rs2409722 | T | G | -7.38261601808 | -0.0314168522186 | 0.00396670505601 | -7.92013819404 | 2.37246749e-15 |
| rs11991118 | T | G | 7.32202915636 | 0.0295263257704 | 0.00395590010421 | 7.46387041953 | 8.40172307848e-14 |
| rs2736313 | T | C | -7.24228035161 | -0.0296988957677 | 0.0039656035404 | -7.48912377779 | 6.93349296434e-14 |
Some comments:
- Only contains SNPs the survive all filters
- Ordered the same across traits
- All columns beginning with
mtag_is produced by MTAG - Default
mtag_betaandmtag_seare unstandardized by genotype- Use the
--std_betasoptions to produce standardized beta/se
- Use the
- Allele columns are aligned across traits (matched to orientation of first input file)
Warning: low sample might lead to non-positive definite estimates of $\Omega$, $\Sigma_{LD}$ (truncated by program)!
Column name options
| Column | option | Default |
|---|---|---|
| SNP ID | --snp_name |
snpid |
| Chromosome | --chr_name |
chr |
| Base-pair position | --bpos_name |
bpos |
| Z-score | --z_name |
z* |
| sample size | --n_name |
n |
| expected allele frequency | --eaf_name |
freq |
| Allele 1 (effect allele) | --a1_name |
a1 |
| Allele 2 (other allele) | --a2_name |
a2 |
Specifying matrix paths
- Use:
--gencov_pathto specify $\Omega$--residcov_pathto specify $\Sigma_{LD}$
- Files must be in the same format as produced by MTAG (contain only the matrix).
Let's try it out . . .
bash 1.4_mtag_matrices.bash
!python ../mtag/mtag.py  \
    --sumstats ../data/1_OA2016_hm3samp_NEUR.txt,../data/1_OA2016_hm3samp_SWB.txt \
    --out ../output/1_basics/1.4_mtag_withMat_NS \
    --gencov_path ../output/1_basics/1.3_mtag_default_NS_omega_hat.txt \
    --residcov_path ../output/1_basics/1.3_mtag_default_NS_sigma_hat.txt \
    --stream_stdout
Filtering: maintain $\Omega$, $\Sigma_j$ assumptions
2. Special Options
- See Online methods of paper for detailed description
- Be cognizant of the assumptions implicit in each option!
Sumstats we will be using
- EA3 Meta-analysis (Okbay et al. 2016):
EducAtt_ea3.txt - Edu_years GWAS with UKB interim release:
EducAtt_ukb.txt
Without special options:
!python ../mtag/mtag.py  \
    --sumstats ../data/EducAtt_ea2.txt,../data/EducAtt_ukb.txt  \
    --out ../output/2_special_opts/2.0_mtag_EA \
    --stream_stdout
!tail -26 ../output/2_special_opts/2.0_mtag_EA.log
--no_overlap: MTAG in the absence of sample overlap
Assumes: no overlap between any of the cohorts in any pair of GWAS sumstats
Action: Sets the diagonal elements of $\Sigma_{LD}$ to 0.
Potential usefulness: In updates to ldsc, will speed up estimation.
bash 2.1_mtag_no_overlap.bash
!python ../mtag/mtag.py  \
    --sumstats ../data/EducAtt_ea2.txt,../data/EducAtt_ukb.txt  \
    --out ../output/2_special_opts/2.1_mtag_no_overlap_EA \
    --no_overlap \
    --stream_stdout
!tail -26 ../output/2_special_opts/2.1_mtag_no_overLap_EA.log
--perfect_gencov: Different measures of the same trait
Assumes: All summary statistics in MTAG are GWAS estimates for traits perfectly correlated with another.
Action: $\Omega$ is equal to outer product of the square root of the vector of genetic variances.
- This pins the genetic correlations to be 1.
Potential usefulness: MTAG on GWAS of different measures of the same trait.
Note: It is sometimes the case that different measures of the same trait are in fact not perfectly correlated (see Meghan Zacher's talk later today).
bash 2.2_perfect_gencov.bash
# 2.2_perfect_gencov.bash
!python ../mtag/mtag.py \
    --sumstats ../data/EducAtt_ea2.txt,../data/EducAtt_ukb.txt \
    --out ../output/2_special_opts/2.2_mtag_perf_gencov_EA \
    --perfect_gencov \
    --stream_stdout
!tail -26 ../output/2_special_opts/2.2_mtag_perf_gencov_EA.log
Compare:
| Analysis | $\Omega$ | Genetic correlation |
|---|---|---|
| Regular | [6.492e-06 4.815e-06] [4.815e-06 3.970e-06] |
[1.000 0.949] [0.949 1.000] |
| No overlap | [6.492e-06 5.026e-06] [5.026e-06 3.970e-06] |
[1.000 0.990] [0.990 1.000] |
| Perfect genetic correlation | [6.492e-06 5.077e-06] [5.077e-06 3.970e-06] |
[1.000 1.000] [1.000 1.000] |
--equal_h2: Performing meta-analysis with mtag
Action: Skips calculation Omega, uses simplified MTAG estimator
bash 2.3_mtag_equal_h2.bash
!python ../mtag/mtag.py  \
    --sumstats ../data/EducAtt_ea2.txt,../data/EducAtt_ukb.txt  \
    --out ../output/2_special_opts/2.3_mtag_perf_gencov_EA \
    --perfect_gencov \
    --equal_h2 \
    --stream_stdout
!tail -26 ../output/2_special_opts/2.3_mtag_perf_gencov_EA.log
3. maxFDR calculations
--fdr: Calculates an approximate upper bound on the FDR based on the framework presented.
- Additional options for:
- Customized set of grid points to calculate FDR (
--grid_file) - Adjusting coarseness of grid (
--intervals) - Parallelization (
--cores) - Sample size approximation (
--n_approx) - Restrict grid points to that those that maintain the prior probability of a null SNP for each trait (in development).
- Customized set of grid points to calculate FDR (
- Default options calculate uses
--intervals 10and a single core.
3.1_max_FDR_basics.bash
# 3.1_max_FDR_basics.bash
!python ../mtag/mtag.py  \
    --sumstats ../data/1_OA2016_hm3samp_NEUR.txt,../data/1_OA2016_hm3samp_SWB.txt \
    --out ../output/3_maxFDR/3.1_mtag_maxFDR_basic_NS \
    --stream_stdout \
    --fdr \
    --stream_stdout
!tail -26 ../output/3_maxFDR/3.1_mtag_maxFDR_basic_NS.log
The number of grid points rises dramatically in the number of traits and inverse size of intervals!
In this case, we recommend that you use --n_approx
  --n_approx            Speed up FDR calculation by replacing the sample size
                        of a SNP for each trait by the mean across SNPs (for
                        each trait). Recommended.
bash 3.2_maxFDR_approx.bash
!python ../mtag/mtag.py  \
    --sumstats ../data/1_OA2016_hm3samp_NEUR.txt,../data/1_OA2016_hm3samp_SWB.txt  \
    --out ../output/3_maxFDR/3.2_mtag_maxFDR_approx_NS \
    --stream_stdout \
    --fdr \
    --intervals 100 \
    --n_approx \
    --stream_stdout
!tail -26 ../output/3_maxFDR/3.2_mtag_maxFDR_approx_NS.log
Output for when using the option is relevant
2017/09/28/05:21:04 PM Calculating FDR by setting number of intervals to 10, and True use of approximation.
2017/09/28/05:21:04 PM T=2
2017/09/28/05:21:04 PM Number of gridpoints to search: 92
2017/09/28/05:21:04 PM Performing grid search using 20 cores.
2017/09/28/05:21:05 PM Grid search: 10.0 percent finished for . Time:     0.006 min
2017/09/28/05:21:05 PM Grid search: 20.0 percent finished for . Time:     0.011 min
2017/09/28/05:21:06 PM Grid search: 30.0 percent finished for . Time:     0.016 min
2017/09/28/05:21:06 PM Grid search: 40.0 percent finished for . Time:     0.022 min
2017/09/28/05:21:06 PM Grid search: 50.0 percent finished for . Time:     0.027 min
2017/09/28/05:21:06 PM Grid search: 60.0 percent finished for . Time:     0.032 min
2017/09/28/05:21:07 PM Grid search: 70.0 percent finished for . Time:     0.037 min
2017/09/28/05:21:07 PM Grid search: 80.0 percent finished for . Time:     0.043 min
2017/09/28/05:21:07 PM Grid search: 90.0 percent finished for . Time:     0.048 min
2017/09/28/05:21:08 PM Grid search: 100.0 percent finished for . Time:     0.054 min
2017/09/28/05:21:08 PM Saved calculations of fdr over grid points in /var/genetics/ukb/huili/mtag/output/main/fdr_calculation/interval_10_True_meanapprox_fdr_mat.txt
2017/09/28/05:21:08 PM <><><<>><><><><><><><><><><><><><><><><><><><><><><><><><><><><><><><><><><>
2017/09/28/05:21:08 PM grid point indices for max FDR for each trait: [90  3]
2017/09/28/05:21:08 PM Maximum FDR
2017/09/28/05:21:08 PM Max FDR of Trait 1: 0.104708870765 at probs = [ 0.8  0.1  0.   0.1]
2017/09/28/05:21:08 PM Max FDR of Trait 2: 0.000149109160478 at probs = [ 0.   0.   0.3  0.7]
2017/09/28/05:21:08 PM <><><<>><><><><><><><><><><><><><><><><><><><><><><><><><><><><><><><><><><>
2017/09/28/05:21:08 PM Completed FDR calculations.
2017/09/28/05:21:08 PM Calculating FDR by setting number of intervals to 10, and False use of approximation.
2017/09/28/05:21:08 PM T=2
2017/09/28/05:21:08 PM Number of gridpoints to search: 92
2017/09/28/05:21:08 PM Performing grid search using 20 cores.
2017/09/28/05:22:30 PM Grid search: 10.0 percent finished for . Time:     1.371 min
2017/09/28/05:23:52 PM Grid search: 20.0 percent finished for . Time:     2.743 min
2017/09/28/05:25:15 PM Grid search: 30.0 percent finished for . Time:     4.112 min
2017/09/28/05:26:37 PM Grid search: 40.0 percent finished for . Time:     5.480 min
2017/09/28/05:27:59 PM Grid search: 50.0 percent finished for . Time:     6.858 min
2017/09/28/05:29:22 PM Grid search: 60.0 percent finished for . Time:     8.230 min
2017/09/28/05:30:44 PM Grid search: 70.0 percent finished for . Time:     9.599 min
2017/09/28/05:32:07 PM Grid search: 80.0 percent finished for . Time:     10.978 min
2017/09/28/05:33:29 PM Grid search: 90.0 percent finished for . Time:     12.350 min
2017/09/28/05:34:52 PM Grid search: 100.0 percent finished for . Time:     13.728 min
2017/09/28/05:34:52 PM Saved calculations of fdr over grid points in /var/genetics/ukb/huili/mtag/output/main/fdr_calculation/interval_10_False_meanapprox_fdr_mat.txt
2017/09/28/05:34:52 PM <><><<>><><><><><><><><><><><><><><><><><><><><><><><><><><><><><><><><><><>
2017/09/28/05:34:52 PM grid point indices for max FDR for each trait: [90  3]
2017/09/28/05:34:52 PM Maximum FDR
2017/09/28/05:34:52 PM Max FDR of Trait 1: 0.104764850463 at probs = [ 0.8  0.1  0.   0.1]
2017/09/28/05:34:52 PM Max FDR of Trait 2: 0.000149016665847 at probs = [ 0.   0.   0.3  0.7]
2017/09/28/05:34:52 PM <><><<>><><><><><><><><><><><><><><><><><><><><><><><><><><><><><><><><><><>
2017/09/28/05:34:52 PM Completed FDR calculations.
Workflow for running maxFDR
Run MTAG in the background, work with results while maxFDR is still running.
Questions?
Ways to get help:
- Check out the tutorials available on the Github wiki
- Refer back to the original MTAG paper (especially the Supplementary Note)
- For troubleshooting, post a message on the Google Group
- If you find any bugs/errors, open up an issue on Github
- Finally, email: maghzian@nber.org
Conclusion
MTAG allows analysis of GWAS of multiple correlated traits using summary statistics
Identifies more loci and improves polygenic prediction for depressive symptoms, neuroticism, and subjective well-being
Code is publicly available at: https://github.com/omeed-maghzian/mtag